PMI – DATA VIZ
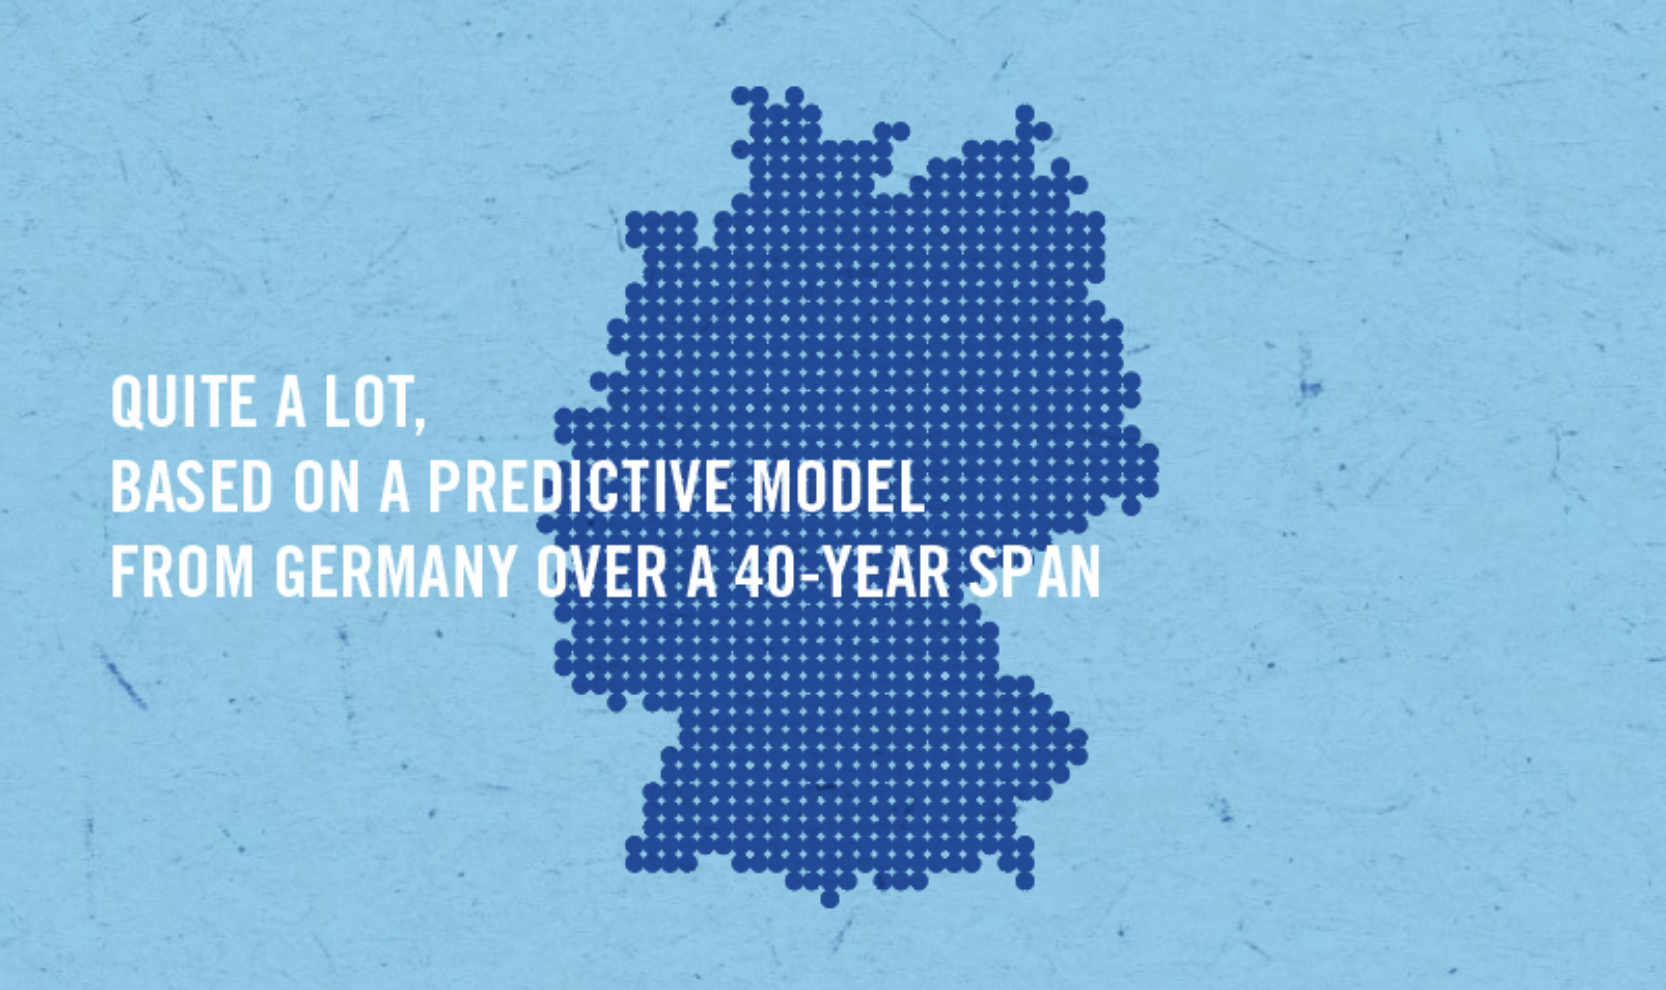
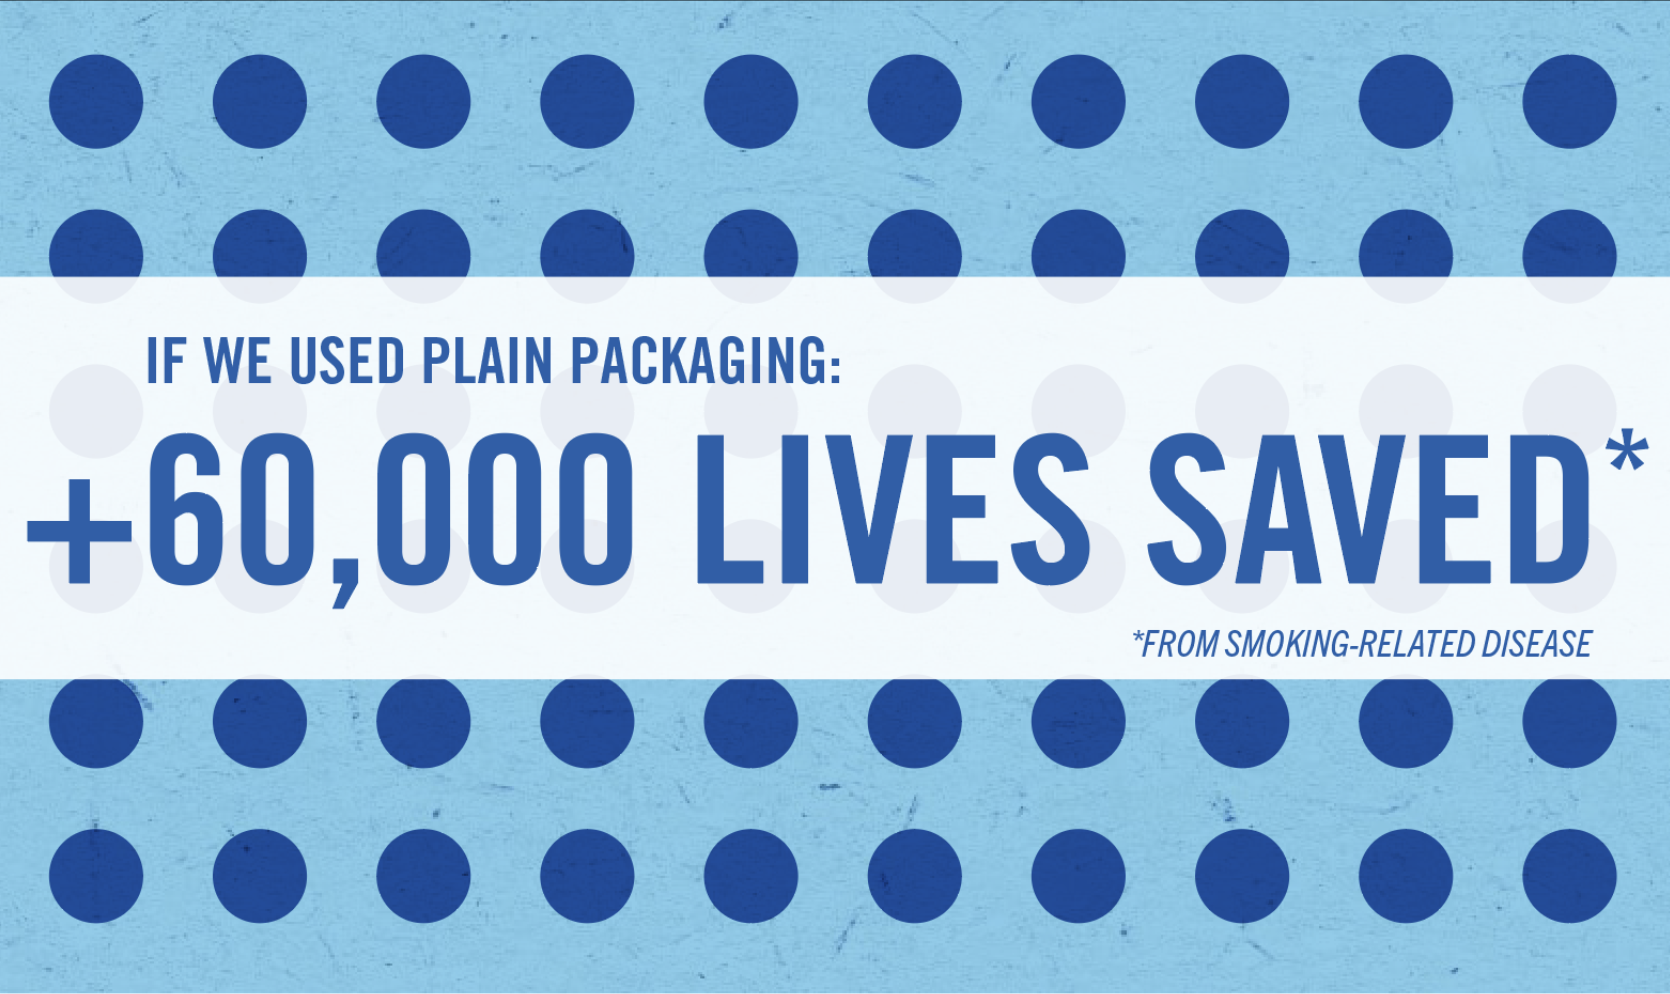
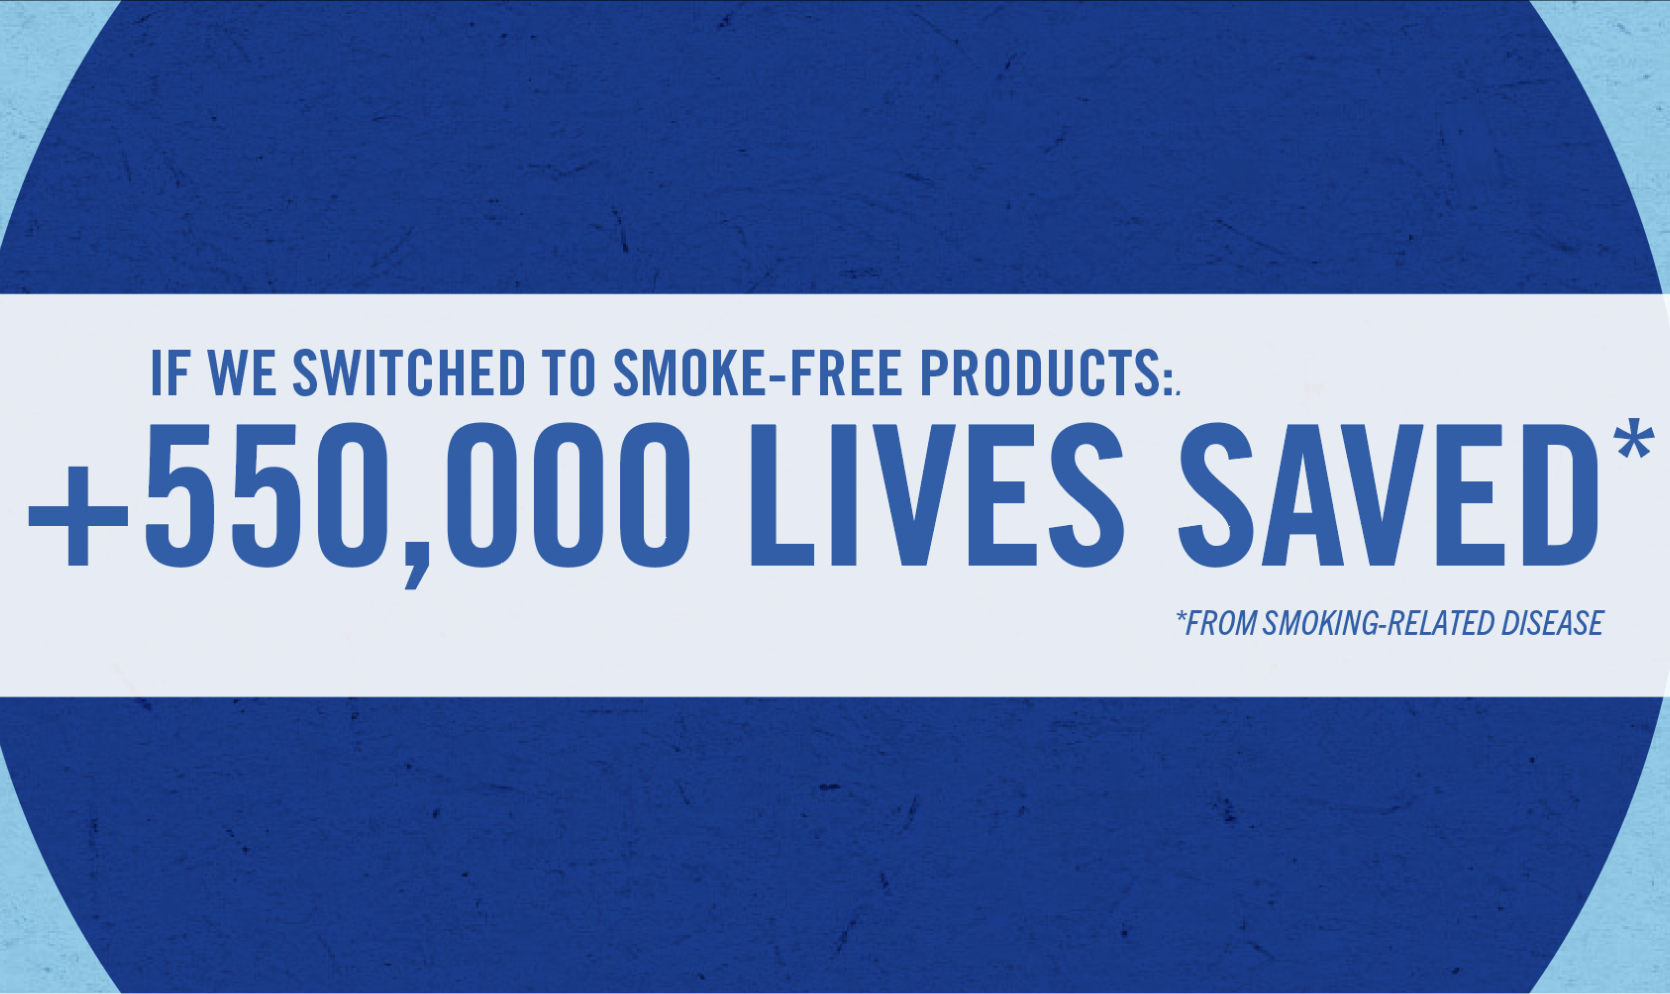
This was my first assignment for PMI – which was to create a data visualization for the number of lives saved if people switched to smokeless options – based on a study in Germany they were able to make predictions on a larger scale. Using a very simple visual device as a colored dot we were able to illustrate the volume of people in an abstract way, but still maintain a warm human quality through the animation. One of my favorite references was a very famous 1965 Chuck Jones cartoon called “The Dot and the Line: A romance in lower mathematics”


PMI – DATA VIZ (VERSION 2)
This was my personal favorite concept. Using the AI tool MAYA we could generate crowds of people representing a large volume of lives saved. I felt this would have been very unique to the category as well as visually engaging.